As internal or external consultants, we are often asked to explain what we mean by “human performance technology,” or “performance improvement.”
Thanks to ISPI and especially to Lynn Kearny, we have a set of visuals* we can use to illustrate and explain the main concepts.
In just two pages, Lynn has illustrated:
- Focus on Results
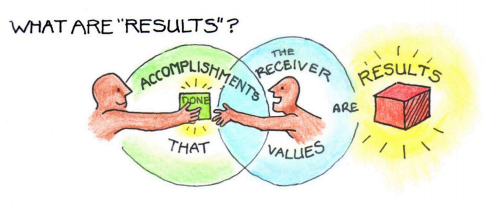
- What Are “Results”?
- What is “Performance”?
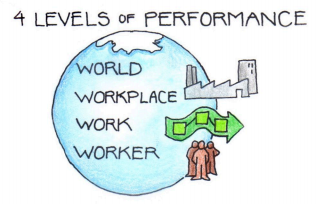
- 4 Levels of Performance
- How Can You Improve Performance?
- The Performance System
- Performance Drivers
In addition to the graphics, Lynn has graciously included five pages of talking points, with examples and suggestions about how to tailor your conversation for different audiences.
Thank you, Lynn!
Whether you want to explain performance improvement to someone else or you’d like to understand it better yourself, it’s worth taking more than a cursory look at this tool.
If you’ve had the pleasure of trying to explain this fairly complex set of processes to people, I’d love to hear what you think is the most challenging part of it—or what works best for you.
Resources
Site | International Society for Performance Improvement (ISPI)
Site | Graphic Tools for Thinking & Learning
Tool | What Is Performance Improvement? (pdf)
*I originally linked to the visuals pdf on the ISPI site, but that file is quite large (11MB). I have made a compressed version that I link to in the post. If you would like to download the original, get it here.


